Credit Quality
Our Temasek Credit Profile is a snapshot of our credit quality and financial strength. For these ratios, the lower the percentage, the higher the credit quality.
(for year ended 31 March)
Total Debt 5%
of Net Portfolio Value

- Total Debt
- Net Portfolio Value
Total Debt 12%
of Liquid Assets

- Total Debt
- Liquid Assets
Interest Expense 3%
of Dividend Income

- Interest Expense
- Dividend Income
Interest Expense 1%
of Recurring Income

- Interest Expense
- Recurring Income
Total Debt due in One Year 3%
of Recurring Income

- Total Debt due in One Year
- Recurring Income
Total Debt due in next 10 Years 18%
of Liquidity Balance

- Total Debt due in next 10 Years
- Liquidity Balance
As an investment company, our dividend income and divestment proceeds are used to pay our business expenses; bond investors; taxes to the government; dividends to our shareholder; and make investments.
For the year ended 31 March 2020, Temasek earned S$12 billion in dividend income and divested S$26 billion. These amounts formed the bulk of our cash inflows.
Unlike pension or oil funds, we do not have inflows from pension contributions or oil revenues.
IFRS 16: Leases took effect during the year ended 31 March 2020. The new accounting standard required us to record our leases, comprising mainly office rental, on our balance sheet. This means that our lease liabilities and interest expense on lease liabilities will be included as part of total debt and interest expense respectively. The credit ratios for March 2020 reflect this change in accounting standards.
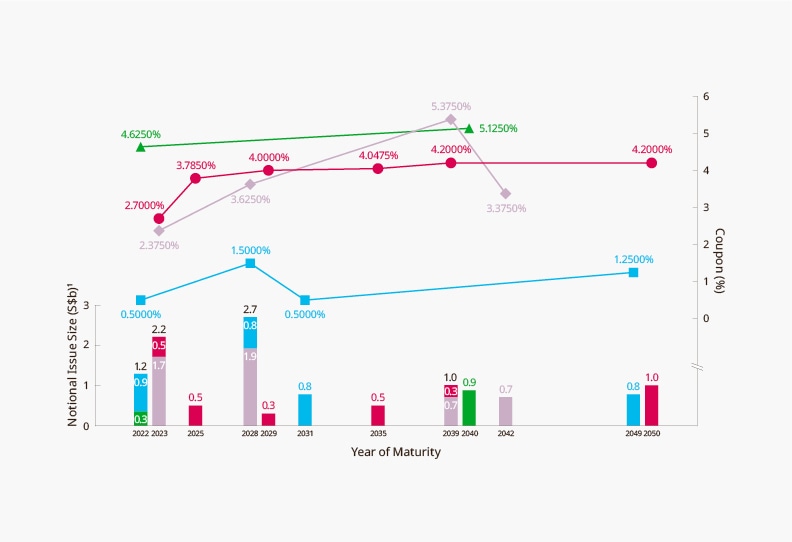
Temasek had S$13.9 billion of debt outstanding as at 31 March 2020.
Our interest expense for the year ended 31 March 2020 was about 3% of our dividend income.
(for year ended 31 March)
Key Credit Parameters (in S$ billion)
| For year ended 31 March | 2016 | 2017 | 2018 | 2019 | 2020 |
|---|---|---|---|---|---|
| Divestments | 28 | 18 | 16 | 28 | 26 |
| Dividend income | 7.8 | 7.0 | 9.0 | 8.5 | 11.9 |
| Income from investments | 0.2 | 0.2 | 0.3 | 0.4 | 0.8 |
| Interest income | 0.2 | 0.2 | 0.2 | 0.4 | 0.7 |
| Interest expense | 0.4 | 0.4 | 0.4 | 0.4 | 0.4 |
| Net portfolio value | 242 | 275 | 308 | 313 | 306 |
| Liquid assets | 74.3 | 91.1 | 110.3 | 112.2 | 112.4 |
| Liquidity balance | 27.1 | 37.6 | 33.2 | 44.2 | 47.1 |
| Total debt | 12.9 | 12.8 | 12.8 | 15.1 | 13.9 |
Discover More